Prometheus Metrics
LaunchPad exposes application metrics in Prometheus text exposition format for monitoring, alerting, and operational dashboards.
Endpoints
| Method | Endpoint | Description |
|---|---|---|
| GET | /api/metrics | Prometheus metrics (admin-only, no CSRF) |
| GET | /api/health | Health check (database connectivity) |
Metrics
| Metric | Type | Description |
|---|---|---|
launchpad_info | gauge | App version, PHP version, Nextcloud version |
launchpad_up | gauge | Whether the application is up |
launchpad_dashboards_total{type} | gauge | Dashboard count by type |
launchpad_widgets_total | gauge | Total widget placements |
launchpad_tiles_total | gauge | Total tiles |
Health Check Response
{"status": "ok", "checks": {"database": "ok"}}
Notes
- Metrics computed on-demand (no persistent storage)
- Content-Type:
text/plain; version=0.0.4; charset=utf-8 @NoCSRFRequiredfor external monitoring tool access
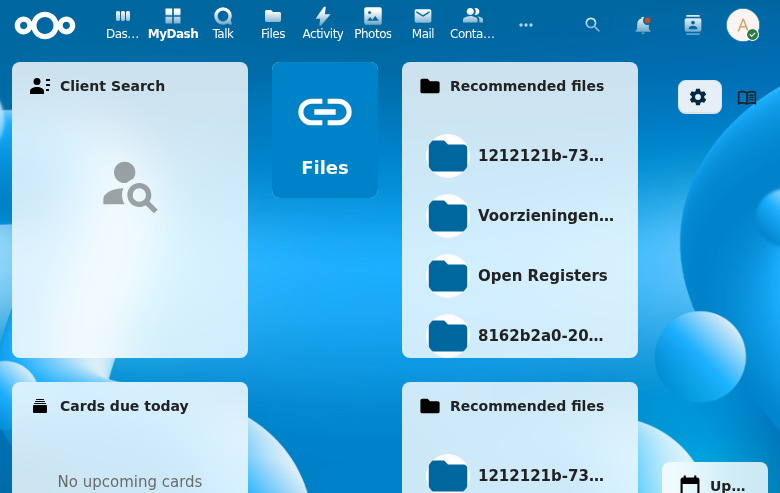
Screenshot